MECH 3992, Mechanical Laboratories in Thermofluids
Hovercraft Aerodynamic Optimization
A CFD and experiment driven redesign of a foam-board hovercraft that rebalances skirt airflow with a flow director and graduated intake holes.
6.42 m/s
Top speed (Phase 2)
14 deg
Flow splitter angle
30 Pa
Lift pressure (analytical)
100 g
Total mass
3
Analysis methods
Overview
A Phase 2 redesign of a laser-cut foam-board hovercraft built to maximize top speed. SolidWorks Flow Simulation, analytical momentum and Bernoulli analysis, and load-cell testing guided two changes: a 14 degree flow director that splits airflow cleanly into the skirt channels, and graduated intake holes that even out flow from back to front. The craft reached 6.42 m/s with a more balanced skirt flow, though the added mass cut top speed 12.5 percent against a Phase 1 setup that benefited from a misplaced splitter gap.
Problem
The hovercraft channels airflow from a single fixed BLDC motor, propeller, and duct into a plastic-film skirt to generate lift and forward motion. The motor, propeller, and duct cannot be changed, so every improvement targets airflow distribution, weight, and drag.
Phase 1 testing exposed uneven air distribution in the skirt that slowed the craft, with stagnant high-pressure zones where flow struck the channel back walls. Phase 2 set out to maximize top speed by redistributing skirt airflow, fixing the flow splitter at 14 degrees, the best-performing angle found in Phase 1.
Analysis Methods
Three methods worked in tandem. The analytical model reduced the rectilinear momentum equation to a static thrust relation, F = rho A V squared, showing that reducing frontal area and increasing thrust raise top speed, while conservation of mass and Bernoulli pointed to minimizing the perimeter-to-area ratio and internal pressure to improve lift efficiency.
Those equations set the numerical boundary conditions: a 0.91 N lift force and a 30 Pa lift pressure drove the internal flow. Experimental velocity tests ran on a circular guide-arm track, and a static thrust test used a load cell. Battery placement mattered: mounting it on the flow splitter reached 6.42 m/s versus 4.33 m/s in front of the duct.
Numerical simulation used SolidWorks Flow Simulation 2024 in separate internal and external flow studies, treating the air as incompressible at atmospheric conditions with pressure-driven flow.
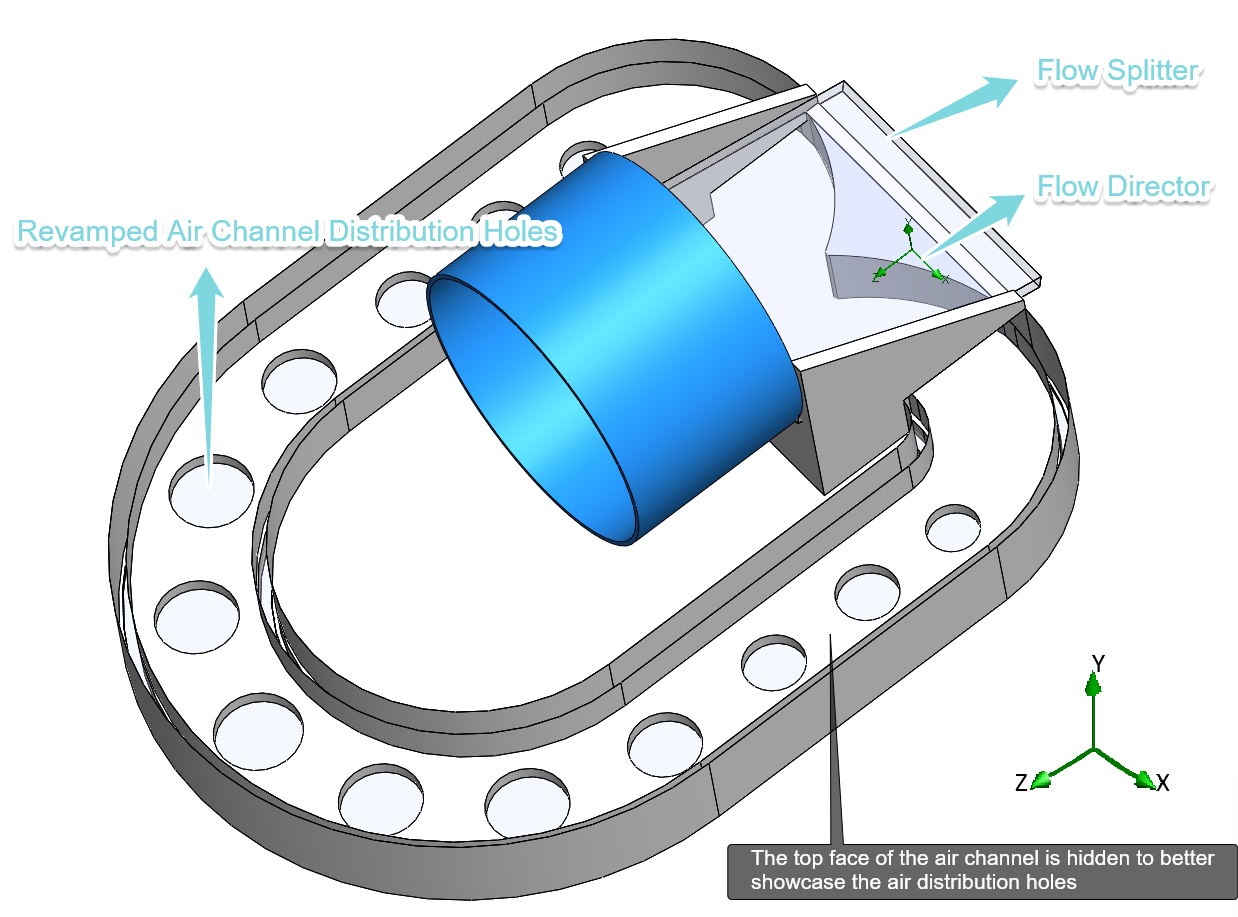
Flow Director
The Phase 1 splitter left a crevice that raised speed only because the test track was circular. Phase 2 replaced it with a Flow Director: a 14 degree top face that sets the splitter angle, two curved front faces, and a center fillet that steer flow into the two channels and ease manufacturing.
CFD trajectories confirmed the change. The Phase 1 profile showed flow slamming the channel back walls, creating turbulence, eddies, and a high stagnant-pressure zone. The Phase 2 profile directed flow into the separate channels without the sudden impact.
Graduated Intake Holes
The channel intake holes were redesigned to grow from small at the back to large at the front, pushing more air toward the front of the skirt where Phase 1 ran short.
Cut-plot velocity profiles taken 2.54 mm below the holes showed the effect: Phase 1 concentrated flow in the rear holes, while Phase 2 distributed flow evenly through every hole, matching the even-distribution objective.
Results & Tradeoff
The combined changes evened out the skirt flow, but raw speed fell. The hovercraft reached 6.42 m/s, a 12.5 percent decrease from Phase 1. The flow director added 7 g to a 100 g craft, and the analytical model showed that added mass outweighed the airflow gains for top speed.
Part of the Phase 1 advantage was also an artifact: a gap left at the back of the splitter raised speed only on the circular track and was removed for Phase 2. The redesign therefore traded measured top speed for the cleaner, more repeatable airflow it was built to deliver.
Outcome & Key Learnings
Phase 2 met its airflow-distribution goal but not the raw-speed goal, a clear mass-versus-flow tradeoff that the three methods agreed on. The internal-flow redesign worked; the weight it cost did not pay back in speed.
An external-flow CFD study set the next targets: frontal drag and a low-pressure wake behind the splitter. Future work is to reduce weight and improve external aerodynamics while keeping the improved internal distribution.
Image Gallery
Additional renders, drawings, and analysis outputs from the project.
Next project
Ground Rover Structural Redesign